

The EU has signed the Global Methane Pledge but action to slash methane emissions in the energy and agriculture sectors is lagging behind. Urgent measures are needed to reduce methane emissions while at the same time much more action is also needed to reduce all other greenhouse gas emissions.
Methane (CH4) is a powerful greenhouse gas, second only to carbon dioxide (CO₂) in its overall contribution to climate change and responsible for about a third of current climate warming. Although it remains in the atmosphere for a shorter period than carbon dioxide (around 12 years), methane is a far more powerful climate forcer (with a global warming potential of around 28 times that of carbon dioxide over 100 years and around 81 times over 20 years). The Intergovernmental Panel on Climate Change (IPCC) notes that deep reductions in methane emissions must be achieved by 2030 for the world to stay below the Paris Agreement’s 1.5°C global temperature target. The most recent Assessment Report of the IPCC (AR6) underlines the role of methane as one of the main greenhouse gases responsible for climate change. The report explains that methane levels are at an all-time high and well above emission levels compatible with limiting warming to 1.5°C. There is thus a need for a sharp, rapid and sustained reduction in methane emissions to slow down global average temperature rise.
As greenhouse gases differ in how they impact temperature rise and climate change, scientists and policymakers use simple accounting measures called ‘metrics’ to compare the effects of different gases. Metrics can be used to place emissions of different greenhouse gases on a common scale, usually taking CO₂ as the reference, thus expressing emissions as CO₂-equivalents (CO₂-e). One of the most commonly used metrics is the Global Warming Potential (GWP). GWP measures the climate effect resulting from emissions of a given greenhouse gas over a chosen time horizon, relative to the effect of emissions of CO₂ (the reference gas). As greenhouse gases differ in how long they persist in the atmosphere, the choice of time horizon can strongly influence the metric and reflects a value judgement with respect to short- and long-term priorities of mitigation and temperature targets. For example, CH4 has a lifetime of around 12 years and a GWP of around 28 (meaning 1 unit of methane is counted as equivalent to 28 units of CO₂) over a time horizon of 100 years (GWP100), and a GWP of around 81 over a much shorter period of 20 years (GWP20) (see table 1 from the IPCC’s Sixth Assessment Report).
Table 1. Emissions metrics for selected species: global warming potential (GWP), global temperature-change potential (GTP).
| Species | Lifetime (Years) | Radiative Efficiency (W m–2 ppb–1) | GWP-20 | GWP-100 | GWP-500 | GWP-50 | GWP-100 | CGTP-50 (Years) | CGTP-100 (Years) |
| CO₂ | Multiple | 1.33 ± 0.16 ×10⁻⁵ | 1. | 1.000 | 1.000 | 1.000 | 1.000 | ||
| CH₄-fossil | 11.8 ± 1.8 | 5.7 ± 1.4 ×10⁻⁴ | 82.5 ± 25.8 | 29.8 ± 11 | 10.0 ± 3.8 | 13.2 ± 6.1 | 7.5 ± 2.9 | 2823 ± 1060 | 3531 ± 1385 |
| CH₄-non fossil | 11.8 ± 1.8 | 5.7 ± 1.4 ×10⁻⁴ | 79.7 ± 25.8 | 27.0 ± 11 | 7.2 ± 3.8 | 10.4 ± 6.1 | 4.7 ± 2.9 | 2675 ± 1057 | 3228 ± 1364 |
| N₂O | 109 ± 10 | 2.8 ± 1.1 ×10⁻⁴ | 273 ± 118 | 273 ± 130 | 130 ± 64 | 290 ± 140 | 233 ± 110 | ||
| HFC-32 | 5.4 ± 1.1 | 1.1 ± 0.2 ×10⁻¹ | 2693 ± 842 | 771 ± 292 | 220 ± 87 | 181 ± 83 | 142 ± 51 | 78,175 ± 29,402 | 92,888 ± 36,534 |
| HFC-134a | 14.0 ± 2.8 | 1.67 ± 0.32 ×10⁻¹ | 4144 ± 1160 | 1526 ± 577 | 436 ± 173 | 733 ± 410 | 306 ± 119 | 146,670 ± 53,318 | 181,408 ± 71,365 |
| CFC-11 | 52.0 ± 10.4 | 2.91 ± 0.65 ×10⁻¹ | 8321 ± 2419 | 6226 ± 2297 | 2093 ± 865 | 6351 ± 2342 | 3536 ± 1511 | ||
| PFC-14 | 50,000 | 9.89 ± 0.19 ×10⁻² | 5301 ± 1395 | 7380 ± 2430 | 10,587 ± 3692 | 7660 ± 2464 | 9055 ± 3128 |
Obviously it is crucial that in both international and national climate policies the metric used is consistent with the choice that informed the Paris Agreement: the Global Warming Potential over a time horizon of 100 years (GWP100). While the Paris Agreement itself allows for different interpretations with regard to the appropriate choice of metric, in the Paris Agreement Rulebook countries agreed to use the GWP100 metric to report aggregate greenhouse gas emissions and removals. In addition, countries may use other metrics to report supplemental information but the main reporting has to be based on the GWP100 metric.
Advocates for increased action on methane (and other short-lived gases such as HFCs) have been using the GWP20 metric to highlight the importance of action on short-lived gases and to stress the benefits of slashing methane to avoid temporary overshoots of the 1.5°C temperature limit. There have also been proposals that the UNFCCC should adopt a dual-term greenhouse gas accounting standard: using a 20-year GWP alongside the presently accepted 100-year GWP. Because many countries’ Nationally Determined Contributions (NDCs) and Long-Term Low Greenhouse Gas Emissions Development Strategies have a “basket of gases” approach, where the emissions of greenhouse gases are weighted by the GWP100 metric, shifting greenhouse gas emission reduction goals to be set under a 20-year GWP increases the weighting of short-lived gases in any target. This would have the consequence of significantly increasing the reductions of gases like methane while reducing the pressure on long-lived gases like CO₂. It is argued that the advantage of such a change would be to more rapidly reduce short-term warming and buy time for CO₂ reductions.
Multiple scientists have spoken out to make it clear that such changes would be counterproductive and the benefits overstated. They conclude that:
- Within a basket of gases approach, differentially reducing emissions from short-lived gases more than CO₂ may reduce the rate of warming for several years, but the relative cooling effect will diminish in time and be massively outweighed by the additional warming over subsequent decades and centuries caused by the relatively higher concentrations of CO₂;
- As a consequence, introducing a 20-year GWP in reporting or accounting would likely give countries a perverse incentive to refrain from the deep reductions of CO₂ emissions that have already been delayed for far too long;
- This would result in higher CO₂ concentrations than would otherwise be the case. Which would not only affect climate change but would also increase ocean acidification (resulting from higher levels of CO₂ absorption by our oceans);
- Given the ultimate objective of the Convention in its Article 2 to “prevent dangerous interference in the climate system”, moving to an accounting framework that reduces mitigation focus on CO₂, and as a consequence adds to long-term warming compared to the present 100-year GWP approach, does not seem well justified;
- If the focus shifts to reducing short-lived greenhouse gases, we shift the burden of increased climate impacts and damages more and more to future generations and would ultimately increase the need to deploy negative CO₂ emissions technology.
Interpreting the Paris Agreement goals by using a metric that is significantly different from the GWP100 metric used in the IPCC Fifth Assessment Report could lead to profound inconsistencies in the mitigation architecture of the Agreement. It could even undermine the integrity of the Agreement’s mitigation target altogether by failing to deliver net-zero CO₂ emissions and thus failing to ensure warming is halted.
An example of how greater emphasis on reducing emissions of non-CO₂ gases within an existing framework can lead to policy changes can be found in the European Commission’s 2030 EU Climate Target Plan. In the Impact Assessment for this proposal, the Commission looked at multiple scenarios, including a scenario with increased action on non-CO₂ gases. In the assessment the Commission analyses the impact of the most ambitious scenarios for reducing non-CO₂ emissions (within a framework where the overall target remains at -55%): “If this level of non-CO₂ mitigation is achieved, it could in principle allow for taking less action on RES and EE to achieve the same 55% GHG reductions.”
Table 2 shows the different impact of scenarios with regular (MIX) and additional action on non-CO₂ emissions (MIX-non-CO₂ variant).
| BSL | MIX-50 | REG | MIX | MIX-non-CO₂ variant | CPRICE | ALLBNK | |
| % change 2030 GHG emissions versus 1990 | |||||||
| Total GHG incl. LULUCF112 | -46.9% | -51.0% | -55.0% | -55.0% | -55.1% | -55.0% | -57.9% |
| Total GHG excl. LULUCF | -45.1% | -49.0% | -52.8% | -52.8% | -52.8% | -52.8% | -55.5% |
| % change 2030 GHG emissions versus 2015 | |||||||
| CO₂ emissions | -32.7% | -37.7% | -42.7% | -42.6% | -41.9% | -42.6% | -46.0% |
| Supply side113 | -50.3% | -58.0% | -67.3% | -67.5% | -65.7% | -67.5% | -73.1% |
| Power generation114 | -53.0% | -60.8% | -69.6% | -70.8% | -68.7% | -70.4% | -76.1% |
| Industry115 | -18.2% | -20.3% | -21.0% | -22.4% | -22.1% | -23.3% | -25.1% |
| Residential | -47.2% | -56.5% | -63.6% | -62.0% | -61.9% | -61.0% | -64.8% |
| Services | -48.7% | -56.5% | -53.5% | -57.8% | -58.1% | -60.4% | -60.6% |
| Agriculture energy | -30.5% | -36.3% | -37.0% | -37.3% | -37.4% | -37.7% | -39.2% |
| Transport | -12.5% | 14.9% | -17.6% | -16.3% | -16.4% | -15.6% | -17.7% |
| Of which Road Transport | -16.4% | -18.3% | -20.7% | -19.6% | -19.6% | -18.9% | -20.6% |
| Intra EU aviation & navigation | 23.5% | 16.7% | 11.6% | 13.7% | 13.7% | 14.4% | 8.5% |
| Non-CO₂ emissions | -22.3% | -26.7%; | -31.0% | -31.0% | -34.5% | -31.0% | -34.5% |
It should be noted that in all scenarios of the 2030 Climate Target Plan, reductions of methane emissions will be lower than the reductions that will be achieved for CO₂ emissions. There are multiple reasons for this, including that: (a) methane emissions were reduced substantially faster than CO₂ emissions prior to 2015 and hence CO₂ emission reductions are catching up; (b) most methane reductions were achieved in the energy sector and reductions would now have to focus on the agriculture and waste sectors which are harder to achieve; and (c) in general EU emissions reductions have taken place more stringently under the EU Emissions Trading Scheme, which only covers CO₂ emissions.
So before looking at 2030 methane policies and targets, let’s have a look at the evolution of methane emissions in the EU. Four elements are important:
- Methane emissions were, on average, reduced more sharply than CO₂ emissions until the start of substantial climate action in the EU in 2005, after which emission reductions in CO₂ and greenhouse gases overall have caught up;
- The biggest reductions in methane emissions occurred prior to the start of EU climate action in 2005 and reductions have slowed down (rather than increased) since then;
- These early reductions in methane emissions occurred most prominently in Central and Eastern European (“new”) member states that joined the EU in 2004 or later, and thus can be linked to economic developments that happened after the break-up of the Warsaw Pact rather than to dedicated action; and,
- Reductions in methane emissions were largest in the energy sector, while emission reductions in the waste and agricultural have been slow, leading to an increase in the share of methane emissions from these two sectors from 78% in 1990 to 88% in 2020.
First, comparing reductions in methane and in CO₂ emissions. Graph 1 shows the evolution of both methane and CO₂ emissions in the EU27 for the period 1990 to 2020. While CO₂ emissions have seen a slight decrease between 1990 and 2005 (almost exclusively occurring in Central and Eastern Europe), methane emission reductions have been rather stable and have not visibly increased after 2005. By 2020, methane and CO₂ emission reductions are almost at the same level.
Second, comparing reductions in methane emissions pre- and post-2005.
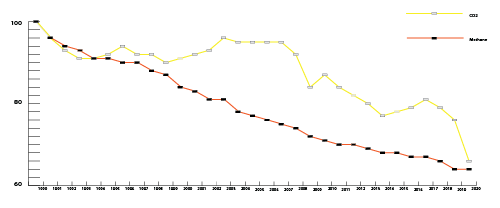
Graph 1: Reductions in EU27 methane and CO₂ emissions since 1990 (source: EEA GHG data viewer)
Table 3 below compares average annual reductions in EU27 methane, CO₂ and overall greenhouse gas emissions for the periods 1990 to 2005 and 2005 to 2020. The numbers clearly show that while EU policies starting from 2005 contributed to increased emission reductions of CO₂ and all greenhouse gases in general, reductions in methane emissions actually slowed down substantially. To be in line with 1.5°C compatible pathway, the EU would need to almost double its annual emission reductions since 2005.
Table 3. Average annual EU27 emission reductions for different gases (source: EEA GHG data viewer).
| Average annual reductions | |||
| Methane | CO₂ | All GHG | |
| 1990-2005 | 1.50 | 0.31 | 0.52 |
| 2005-2020 | 0.90 | 1.96 | 1.70 |
| 1990-2020 | 1.20 | 1.13 | 1.11 |
Third, comparing methane emission reductions in “new” (EU13) and “old” (EU14) member states. Graph 2 shows that reductions in methane emissions have occurred more strongly in the EU’s Central and Eastern European member states, which joined the EU from 2004 onwards (referred to as the “new” member states). Most of this difference happened in the period before 2005. Since then, annual methane emission reductions have been very similar across the EU27.
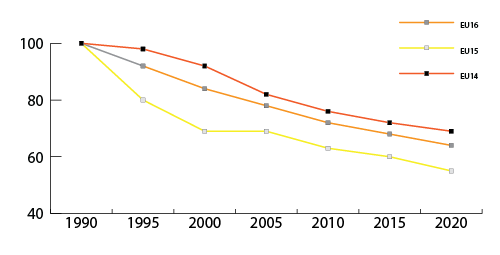
Graph 2: Reductions in methane emissions in the EU27, the “old” member states (EU14) and the “new” member states (EU13) (source: EEA GHG data viewer)
And finally comparing methane emission reductions in different sectors, when looking at the three main sectors where methane emissions occur, we note that a very large share of reductions in methane emissions occur in the energy sector while hardly any progress is made in the agriculture sector (see Graph 3).
Table 4. EU27 methane emissions from different economic sectors (source: EEA GHG data viewer)
| Percentage of total anthropogenic methane emissions in EU27 | |||
| Agriculture | Waste | Energy | |
| 1990 | 44 | 27 | 22 |
| 2005 | 46 | 30 | 17 |
| 2020 | 54 | 27 | 12 |
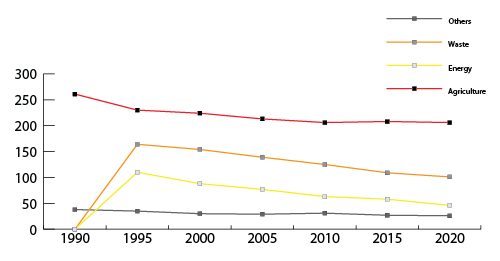
Graph 3: Evolution of EU27 methane emissions from different economic sectors
The EU is a signatory to the Global Methane Pledge that was launched at COP 26 in November 2021 in Glasgow. Participants who joined the Pledge agreed to take voluntary actions to contribute to a collective effort to reduce global methane emissions by at least 30 per cent from 2020 levels by 2030. The Pledge recognises that action on methane must “complement and supplement, not replace global action to reduce carbon dioxide emissions”. More than 150 countries have subscribed to the pledge. Various studies indicate that to be in line with 1.5°C pathways, global methane emissions would need to be reduced by as much as 35 to 45% between 2020 and 2030.
The EU is definitely not on track to contribute fairly to the -30% commitment under the Global Methane Pledge. With current policies, EU methane emissions are estimated to decline by 13.4% between 2020 and 2030. Hence the European Commission developed a Methane Strategy and proposed a Regulation to reduce methane emissions from the energy sector to complement actions in the agriculture and waste sectors that are (to be) embedded in the “Farm to Fork” strategy, the Common Agricultural Policy, the Industrial Emissions Directive, the Landfill Directive and EU waste legislation.
But even then, the EU would lag behind in contributing its fair share to the Global Methane Pledge. When the effect of the proposed Regulation on methane reduction in the energy sector is included, a 15 to 17% reduction could be realised.
CE Delft has calculated that much greater emission reductions, even well beyond 30% are possible through a combination of different measures across sectors:
Three scenarios, which constitute different combinations of methane mitigation measures, have been worked out and their effects on potential EU methane reduction examined.
- In the Maximum scenario, all methane mitigation measures are included, and 100% of EU consumers switch to an advised diet following national dietary health guidelines. This scenario indicates that the maximum methane reduction that could be realised in the EU between 2020 and 2030 is 7.5 to 10.3 Mt/year, or 49 to 68% of annual methane emissions.
- In the Pledge scenario, we have combined measures with which a total EU methane reduction of 30% can be obtained, in line with the Global Methane Pledge ambition. In this scenario, only 10% of EU consumers switch to an advised diet with lower meat and dairy consumption. A reduction of 26 to 34% is estimated to be achievable by means of various methane mitigation measures, distributed among the sectors.
- In the Science scenario, we have combined measures with which a total EU methane reduction of 45% can be obtained, following the scientific advice in the Global Methane Assessment. Here, 50% of EU consumers switch to an advised diet with lower meat and dairy consumption. A total reduction of 38 to 47% is realised through a combination of different measures across sectors.
- It has been made clear multiple times that the EU’s 2030 climate target of at least -55% greenhouse gas emission reductions compared to 1990 levels is not compatible with the Paris Agreement’s 1.5°C target. This target needs to be revised and increased. While that process is underway, increased action on reducing methane emissions should not reduce incentives to reduce CO₂ emissions and should be counted on top of the envisaged reduction of methane emissions under the 2030 Climate Target Plan. This can be done, in a way that is very similar to how carbon removals from Land Use, Land Use Change and Forestry (LULUCF) have been dealt with in the Climate Law.
While the LULUCF Regulation has set a target for carbon removals from LULUCF to be increased to 310 million tons of CO₂ by 2030, the Climate Law stipulates: “In order to ensure that sufficient mitigation efforts are deployed up to 2030, ..., the contribution of net removals to the Union’s 2030 climate target shall be limited to 225 million tonnes of CO₂ equivalents. In order to enhance the Union’s carbon sink in line with the objective of achieving climate neutrality by 2050, the Union shall aim to achieve a higher volume of its net carbon sink in 2030.”
Wendel Trio


